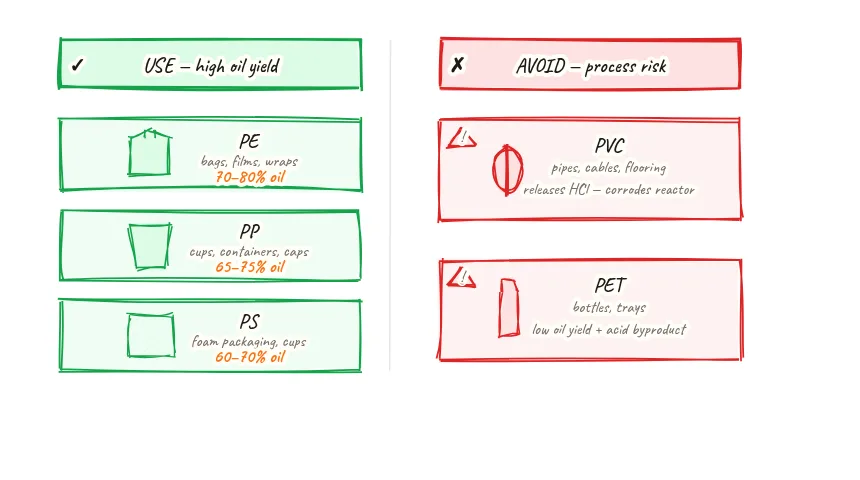
Product Yield Distribution — Good Feed vs Bad Feed
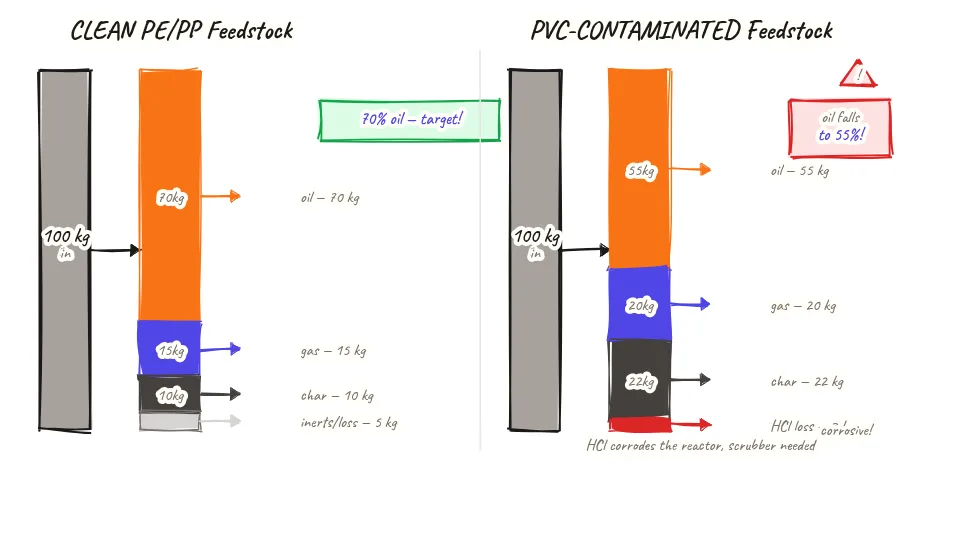
Side-by-side Sankey comparison of clean PE/PP feedstock versus PVC-contaminated feedstock — contamination drops oil yield from 70% to 55%, increases char by 12 kg, and adds corrosive HCl losses that damage equipment and can render the oil unsellable.
Beyond definitions
Planning to start a Plastic Pyrolysis business?
Get the full business understanding — capex, regulations, machinery, vendor questions, and risk checks before you commit capital.
How to read this sketch
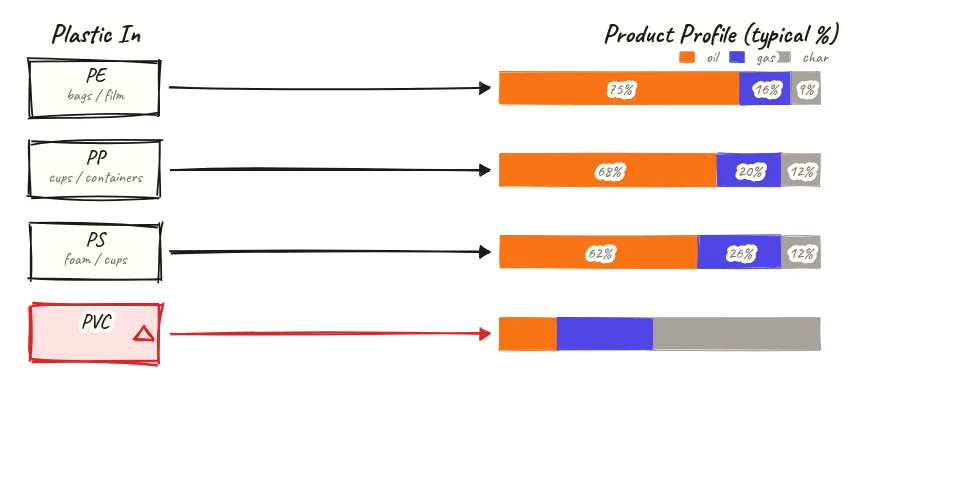
Two horizontal stacked bars arranged one above the other. Each bar represents the same 100 kg input. Read each bar left to right by segment:
- Blue segment (oil): Pyrolysis oil yield. Larger in clean feedstock, notably smaller in contaminated feedstock.
- Orange segment (syngas): Non-condensable gas. Slightly larger in contaminated (PVC cracking produces more gas-phase products).
- Grey segment (char): Carbon char. Significantly larger in contaminated feedstock — PVC chlorinated residue adds to char mass.
- Red segment (HCl losses): Only present in the contaminated bar. Corrosive HCl gas losses — a liability, not a product.
- Warning triangle on contaminated bar: Signals the additional equipment and quality risk from PVC presence.
About this sketch
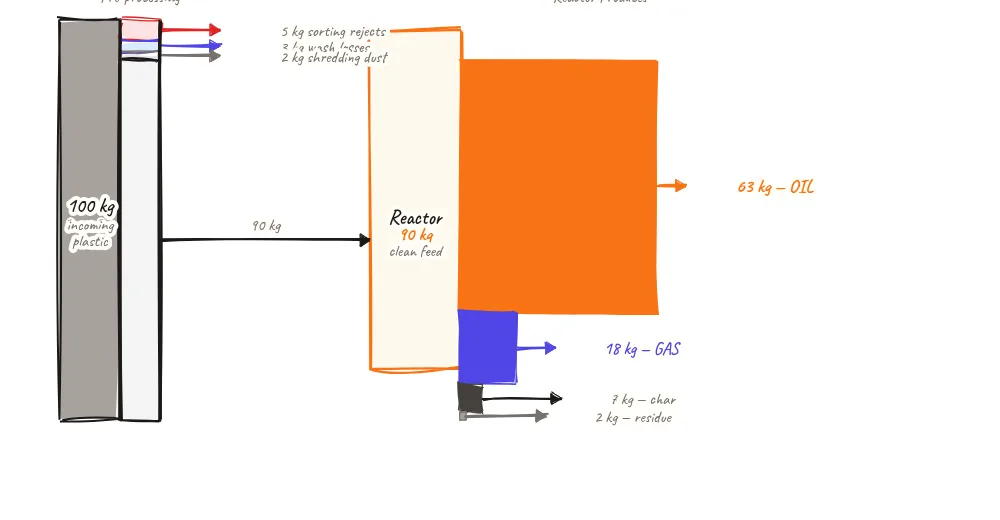
The impact of PVC contamination on pyrolysis yield is quantified clearly in this two-bar Sankey comparison. The left bar shows a clean PE/PP feedstock batch; the right bar shows the same 100 kg input with PVC contamination mixed in.
Clean PE/PP feedstock (left bar): 100 kg input yields approximately 70 kg pyrolysis oil (best-case for a well-run plant with clean industrial PE/PP), 15 kg syngas, 10 kg char, and 5 kg of processing losses. This is the target yield profile that makes the economics of a pyrolysis plant work.
PVC-contaminated feedstock (right bar): The same 100 kg input but with significant PVC mixed in produces a dramatically different result. Oil yield drops to approximately 55 kg — a 21% reduction in the primary revenue source. Char yield increases to 22 kg — PVC leaves a chlorinated carbon residue in the char that also has lower commercial value and may require hazardous waste treatment. Syngas increases to 20 kg, but contains HCl-contaminated gas that requires more intensive scrubbing. The 3 kg HCl loss represents hydrogen chloride that leaves the system as gas, attacking metal surfaces on the way out.
The financial implication is stark: oil yield at 55 kg versus 70 kg is 15 kg less oil per 100 kg feedstock. If this runs for 300 days at 10 TPD (1,000,000 kg per year), contamination reduces oil output by 150,000 kg per year. At current market prices for pyrolysis oil, the yield loss alone represents a large financial gap — separate from the equipment repair costs caused by HCl corrosion.
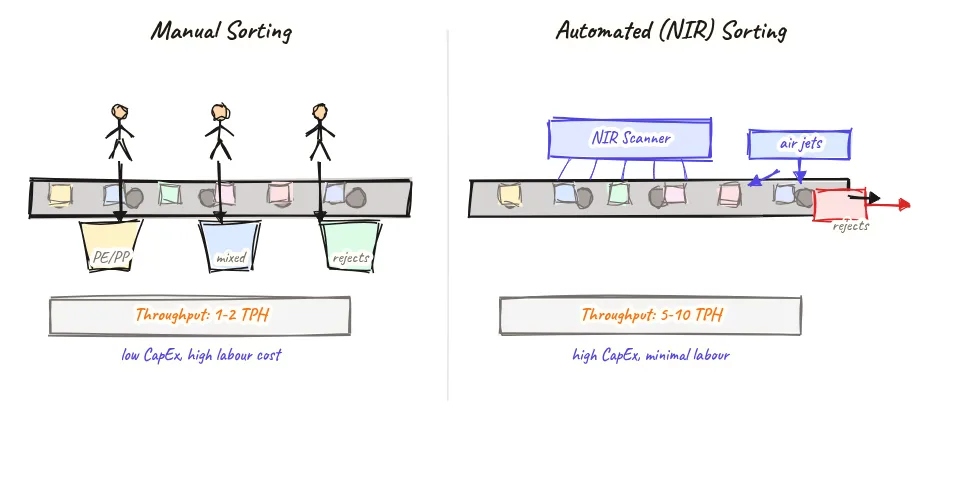
This is why investment in PVC sorting (NIR sorter or trained manual sorting) pays back rapidly and is central to plant economics, not an optional quality improvement.
Key insights
- PVC contamination in feedstock reduces oil yield by approximately 15 kg per 100 kg input — a 21% loss in primary revenue.
- PVC increases char yield significantly (from 10 kg to 22 kg per 100 kg) but the char contains chlorinated residues and may require hazardous waste disposal.
- HCl from PVC cracking corrodes reactor walls, condenser tubes, and vapor lines — the equipment damage cost adds to the revenue loss from lower oil yield.
- Pyrolysis oil from PVC-contaminated batches has elevated chloride content — most buyers reject oil with chloride above 100 ppm, making it unsellable.
- The financial loss from PVC contamination (oil revenue loss + equipment repair) typically covers the entire cost of a NIR sorting system within 12–18 months — the investment case is strong.